Cannot deselect all options for a given filter.
+
The Early Grade Reading Assessment (EGRA) was developed to assess basic skills that provide the foundation for learning to read. The assessment, using distinct subtasks, measures how children are progressing through the stages of reading skill development.
There are three key elements to consider when looking at EGRA data: means, distributions, and zero scores.
During an EGRA, a child is scored on each subtask that is administered. The mean score is the average score of a group or cohort of students on a given subtask. Means give a good overall snapshot of how a group of students is performing at a particular reading skill.
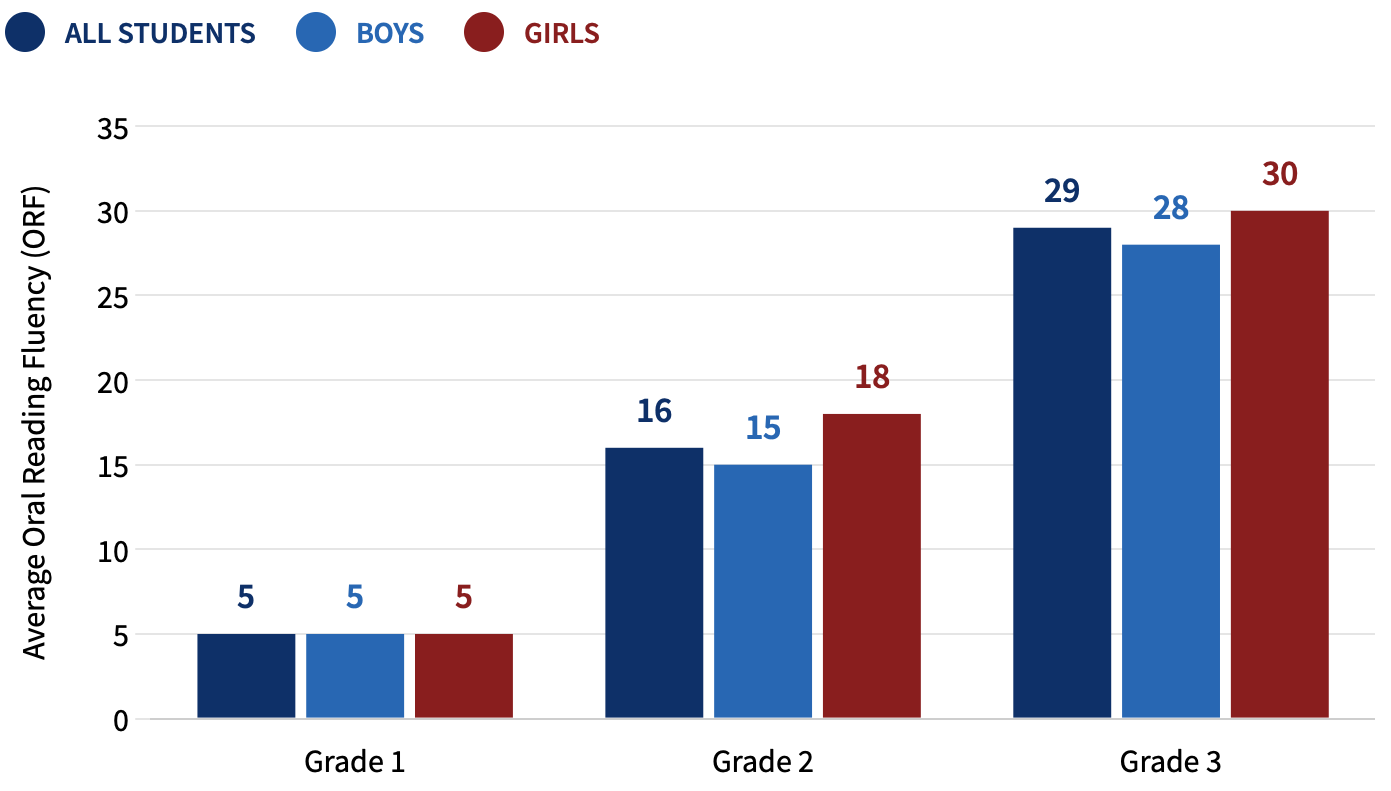
For example, the oral reading fluency (ORF) subtask measures the correct number of words read by a child in 1 minute. In the example below from an EGRA conducted in Nepal in 2020, the mean ORF score increases with each subsequent grade for both girls and boys. This signals that, on average, students improved their reading fluency as they moved up from Grade 1 to Grade 3.
for Students Who Speak Nepali at Home
Mean scores provide useful insight into the progression of reading skills in a group of students over time. However, mean estimates are sensitive to extreme values, or can be affected by outliers like very high or very low scores, such as the number of students scoring zero. This is why it is important to consider the distribution of scores, as well (see below).
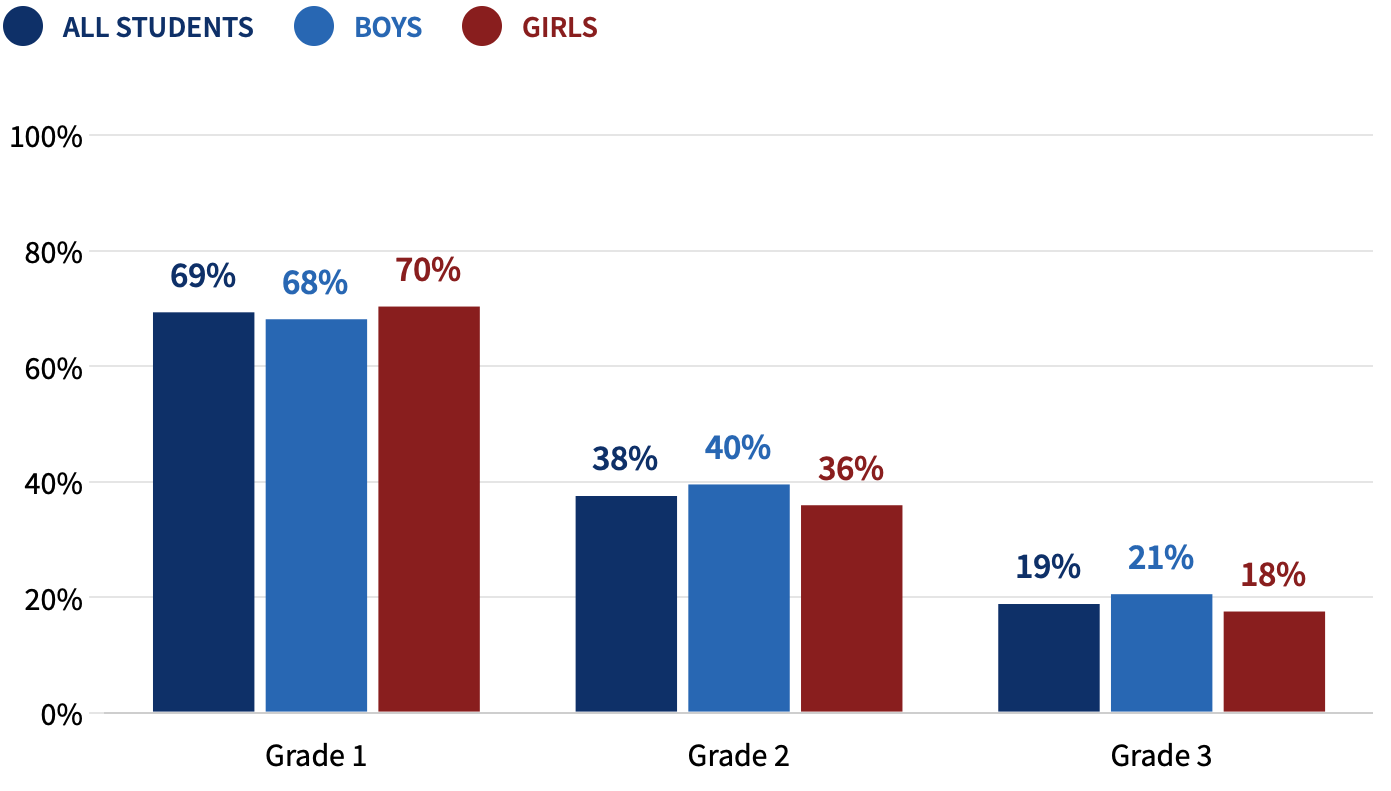
The distribution of scores, presented in the form of histograms on the Barometer, represents the percentage of students who have scored within a given interval.
In the example below from an EGRA conducted in Nepal in 2020, 13% of Grade 1 students received a score between 1 and 10 on the ORF subtask.
for Students Who Speak Nepali at Home
Sometimes children are not able to answer a single question correctly on a given subtask. For example, the student may not be able to identify a single letter sound or read a single word. This results in a subtask score of zero. Zero scores are referred to as the proportion of students who cannot perform even one item correctly for a given subtask. A high proportion of zero scores will cause the distribution of scores to skew right (positively skewed data) and lower the mean score.
Because reading skills are acquired in phases, at any given point in time, some subtasks are likely to have floor effects (or a high proportion of zero scores) depending on where the tested students are in their development. For example, we may expect Grade 1 students to have a lower proportion of zero scores for the letter sounds subtask (a lower-order skill) but a high proportion of zero scores for reading comprehension (a higher-order skill).
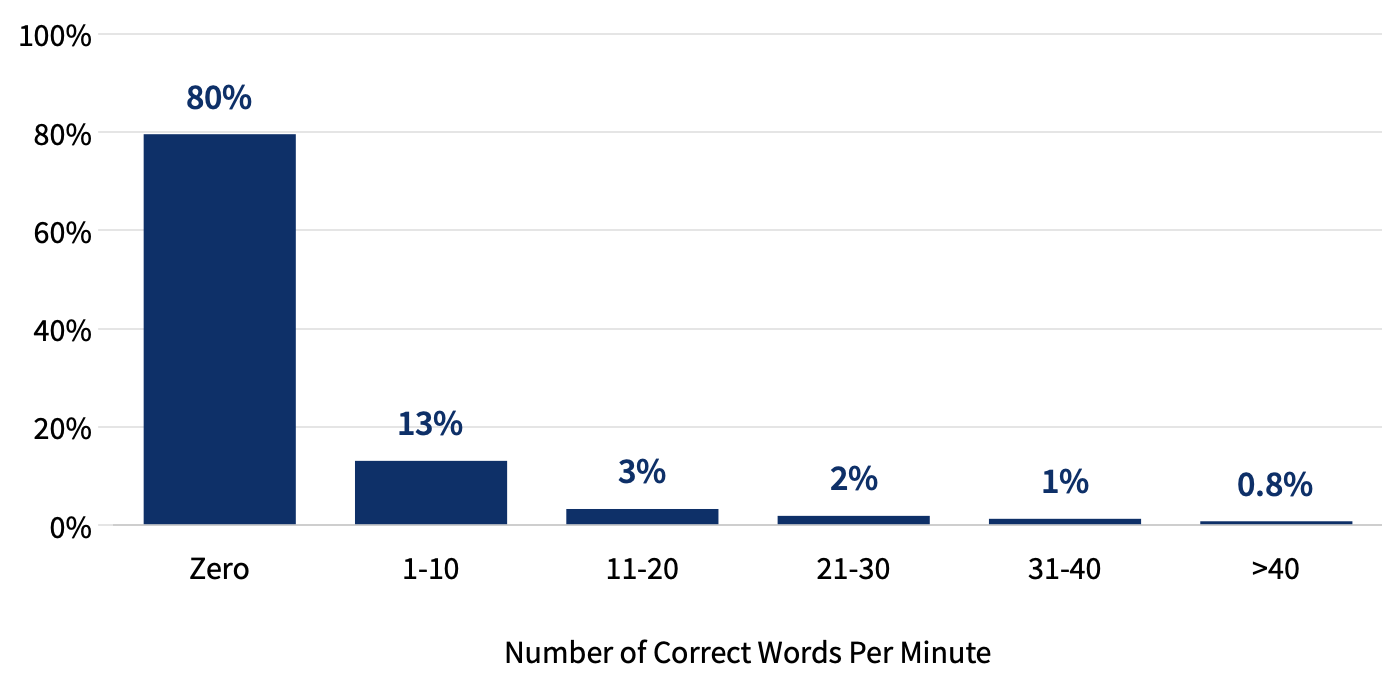
In the example below from an EGRA conducted in Nepal in 2020, the proportion of students who cannot read a single word of connected text (ORF zero score) decreases from Grade 1 to Grade 3 as students’ reading skills improve over time.
for Students Who Speak Nepali at Home
Data presented on the Barometer are separated, or disaggregated, based on the sampling methods used in each study. Typically, studies will focus on specific geographic locations, languages, grades, and cohorts of pupils. The Barometer presents data by all appropriate levels of disaggregation so results can be further contextualized. Use the dropdowns on the Assessment Outcomes pages to explore how these key elements change based on data disaggregation.
These key metrics—means, distributions, and zero scores—can help provide a snapshot of learning outcomes in an education system. They also allow us to track progress over time.
Nationally representative EGRA data can be used by countries to report on how they are meeting self-set benchmarks as well as Sustainable Development Goal 4.1 targets. These data can also be used to evaluate the impact of early grade reading programs or other forms of interventions on learning outcomes.